
Visual Design Examples
Interactive Charts
The Goal
To create a website housing a set of dynamic tools that would help investors manage and track market volatility.
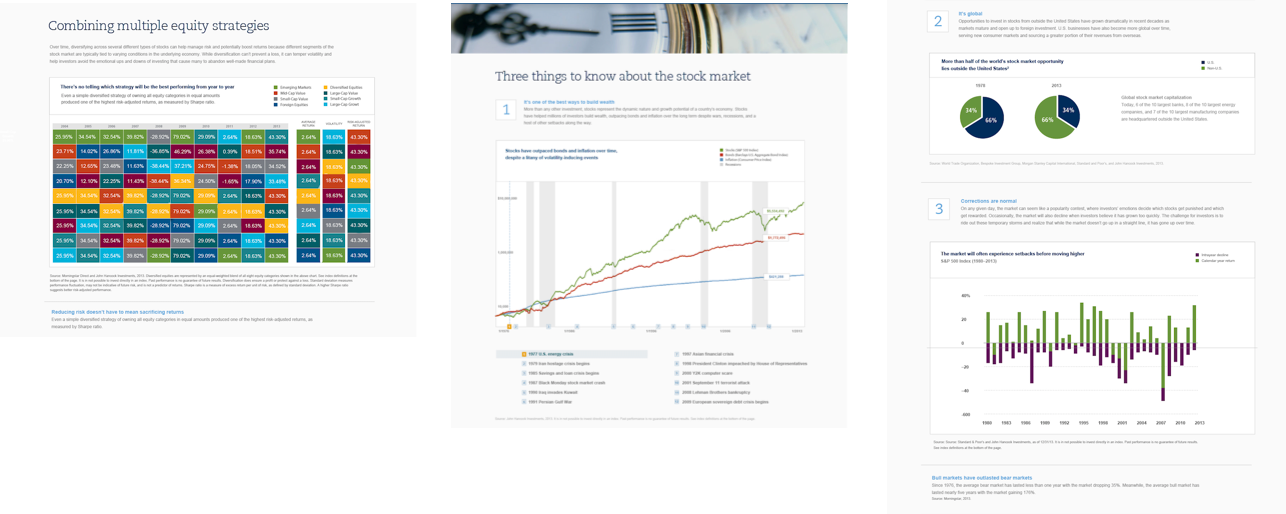
The Result
I was able to deliver several different interactive strategies that helped displayed the information between various screens sizes.
My Tools
Adobe Photoshop
My role
Account/Project Management
Visual Design
Managing Development Process
Infographics
The Goal
To support Boston Marathon activation by designing a series of shareable infographics.
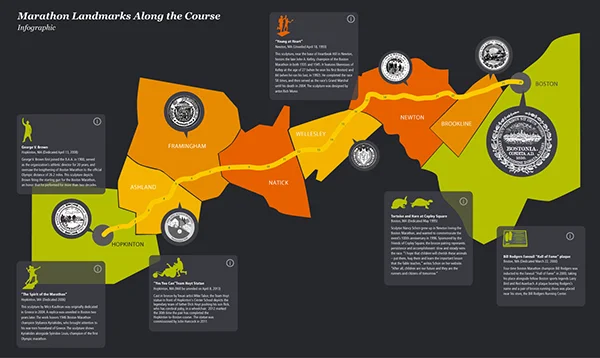
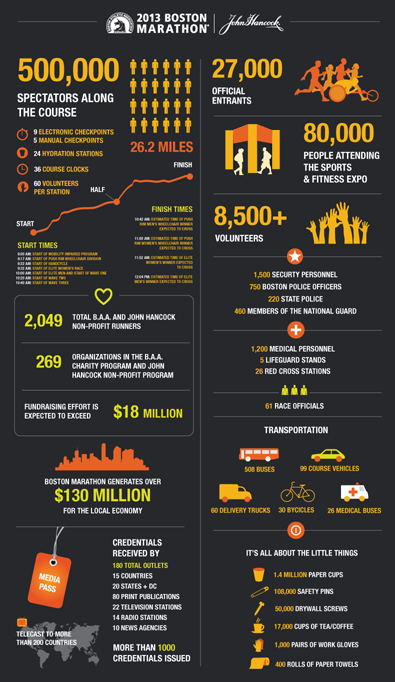
Result
The infographics were very successful on social channels and brought lot of additional visits to the “Media Guide” website. The series was so successful, it was updated yearly (2013 - 2017) and printed to be featured in the Boston Marathon pressroom.
My Role
Visual Design
Account Management
Content Management
My Tools
Adobe Illustrator
Wordpress